
This is the third and final part in a series comparing driver behaviour in London and Paris. Our data science team gathered millions of real data points and transformed them into insights about how Londoners and Parisians behave on the road. Imagine you’re a fleet manager in charge of either city. Trying to influence change in such a big fleet would be daunting. But with our driver behaviour solution, it wouldn’t be impossible.
In our previous blog posts, we looked at speeding and idling. For this post, we’re analysing harsh braking and accelerating, two of the key behaviours that impact road safety and fuel consumption.
Harsh braking and accelerating: how London and Paris compare
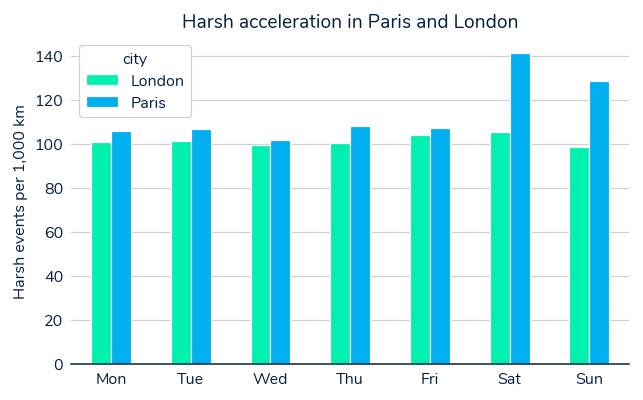
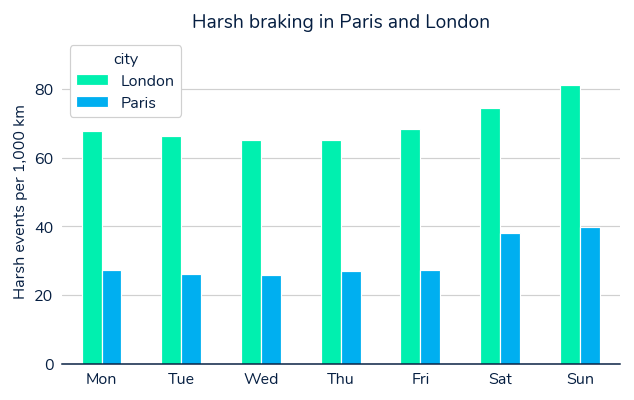
Let’s begin with current performance. Our data found very little difference between the two cities in terms of harsh accelerating. In London, there are an average of 101 events per 1,000km, while in Paris they’re a little quicker off the mark with an average of 108 events. The real difference is in harsh braking. In Paris, there’s a fairly low count of 28 harsh braking events every 1,000km. But London drivers are more than twice as bad, with an average of 68 events every 1,000km driven.
How to improve harsh braking and acceleration
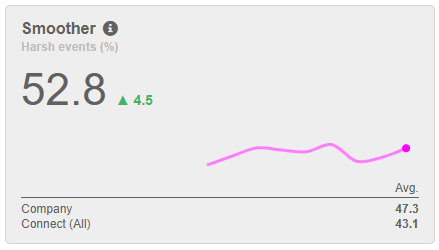
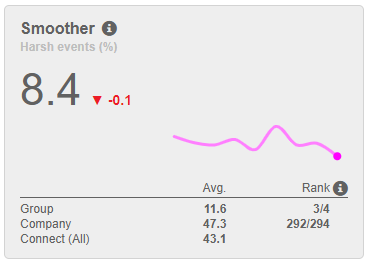
If you’re London’s fleet manager, you have a serious problem. Your drivers are showing a lack of anticipation when it comes to braking. This habit is not only unsafe but it’s also bad for the vehicle. Fortunately, the Smoother score in our driver behaviour solution will show you exactly how you’re performing regarding harsh events.
The score is calculated using data science logic and shows your fleet's performance trend over the previous weeks, as well as benchmarking it against your company as a whole and all Connect users. If you implement a driving behaviour programme to improve your scores, this overview is an easy way to see if it’s having any effect.
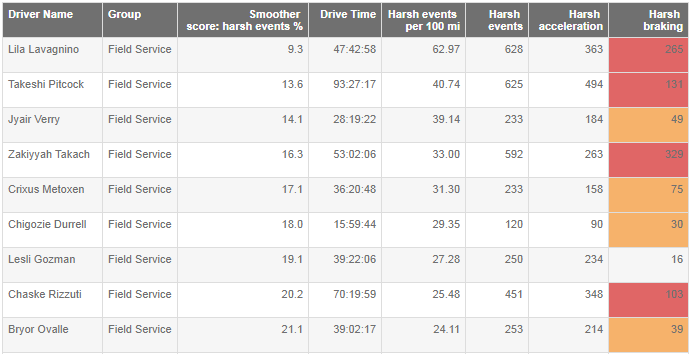
The dashboard also provides a snapshot of the three best and three worst performing drivers. The ‘Show more’ button underneath leads straight to a Smoother driving behaviour report, which lists every driver in the fleet. The London fleet manager could use this to view his entire fleet and see a league table of driver rankings. However, there are thousands of vehicles to look at. He can make his life much easier by tailoring the report to see exactly what he needs, using sorting and conditional formatting to highlight where any tailored training or performance reviews might be necessary.
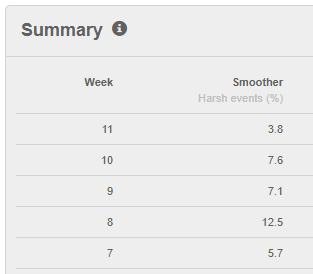
Individual driver scores
As well as a fleet overview dashboard, each driver has an individual dashboard charting their performance. London’s fleet manager can check a driver’s score over time to see whether their bad Smoother score is a one-off or whether it’s a consistent trend and therefore needs to be addressed.
Although drivers in Paris have better anticipation than those in London, it doesn’t mean that they can’t improve too. Even small incremental improvements in driver behaviour can lead to tangible benefits to a business. Some of the most obvious examples are improved safety, reduced costs through lower fuel use, and a lower carbon footprint too.
You can ask for more information by filling in the form on our driver behaviour solution page. If you’d like to learn more about how our data science team can help your business, head to our Catalytix page.