
London and Paris. Two bustling capital cities where countless road journeys are made every day. Imagine if each city was run by a single fleet manager, someone tasked with improving the driving habits of thousands of drivers. Impossible? We don’t think so. Our data science team has analysed millions of data points to measure the driving habits of Londoners and Parisians. So let’s take a look at how they compare – and more importantly, how they can improve.
There was an awful lot of data to sift through. Therefore, we identified three key areas of driver behaviour that we know have a direct impact on road safety, fleet efficiency and the environment:
- Speeding
- Idling
- Harsh braking and acceleration
Speeding: how London and Paris compare
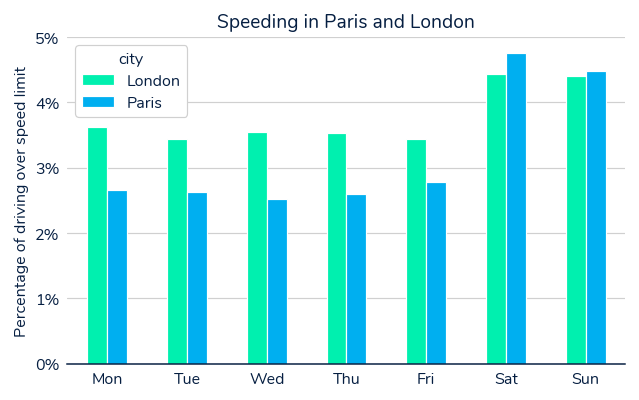
First of all, let’s look at the data. On average, London speeds more than Paris. Not a huge amount, but enough to make driving more dangerous: drivers in London spend on average 3.6% of their time speeding, whereas it’s 2.8% in Paris. But the Parisian fleet manager would be premature to celebrate. If we look deeper, both fleets suffer from the same problem: increased weekend speeding. At the weekend, there’s a noticeable increase to 4.4% in both cities. In Paris on Saturdays, the number actually climbs to 4.7%.
How to improve speeding behaviour
Armed with this knowledge, the fleet managers of London and Paris could simply send an email to their drivers about weekend driving, instructing them to take extra care. But there’s much more they can do with Masternaut.
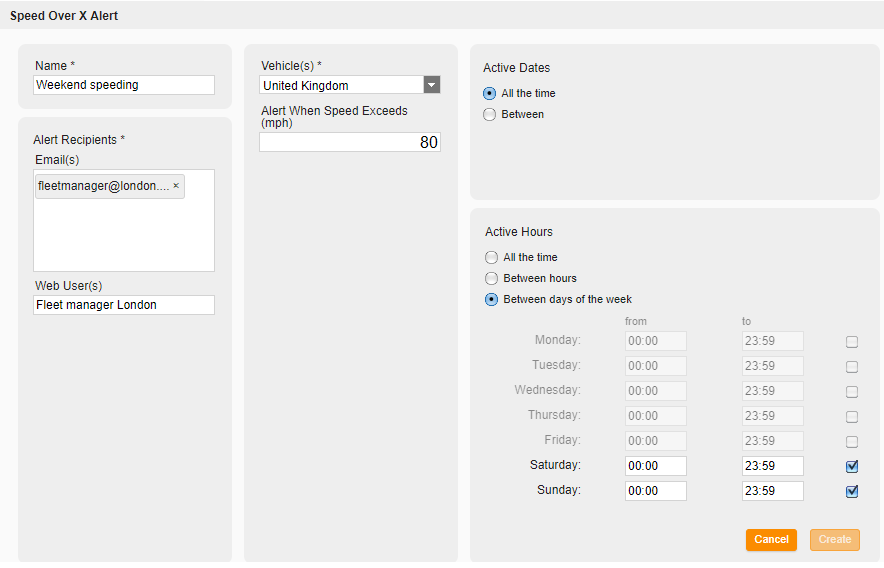
Our Connect platform can help them track and manage speeding, for example by running reports. A driver behaviour report will show instances of speeding, and managers can choose to focus only on weekend speeding by using simple filtering and formatting. Live alerts can also be set up to identify the most serious speeding events, allowing a fleet manager to intervene immediately. This is a quick way to identify anyone at high risk, for example those who are driving more than 10mph faster than the national speed limit.
Changing driver behaviour
Fortunately, both the London and Paris fleets are equipped with our driver behaviour solution. This means every driver gets scored according to their driving behaviour, with tools that allow managers and drivers to keep track of – and improve – performance. We divide behaviour into three scores: Safer, Smoother and Cleaner.
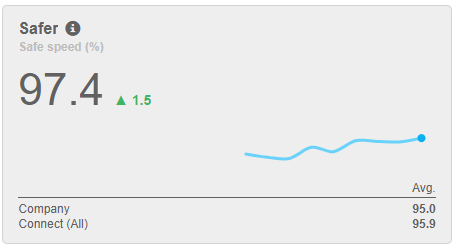
Safer is a measure of speeding: it shows the percentage of total driving time spent within the speed limit. It can be viewed by managers in Connect at fleet level and individual driver level. Both London’s and Paris’ fleet manager can use their fleet’s Safer scores to set realistic targets based on actual data, and view trends over time to see if behaviour is improving.
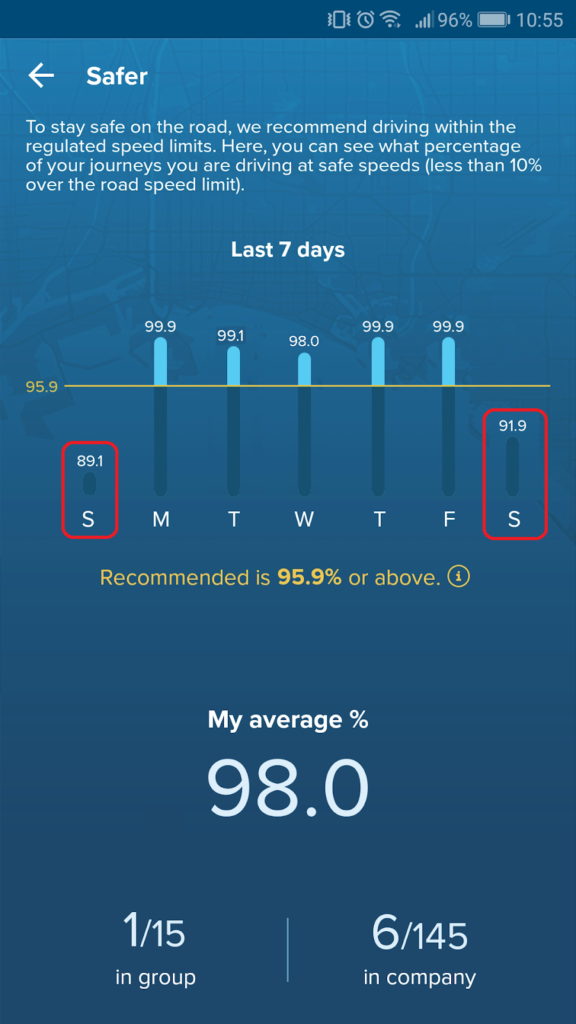
Drivers can also keep track of their own scores using the SmarterDriver app. The app provides a rolling day-by-day score, meaning drivers can easily identify their own habits and see if they’re speeding more at weekends. If they’re conscientious – or have the reward of a driver behaviour programme to motivate them – they’re likely to improve. The app also tells each driver their ranking within the fleet, promoting healthy competition that typically leads to further improvement.
So far, in terms of current performance, the Parisian fleet manager has the slight upper hand. In part two, we’ll look at how to improve fuel wastage and carbon emissions by reducing idling. In the meantime, why not read more about our new driver behaviour scores?
How we collected and analysed the data
The data in this study is taken from the month of July in 2018. Approximately 18,000 vehicles were analysed, with a total of over 740,000 journeys in London, and 175,000 journeys in Paris. It was the work of our in-house data science team who assist on a wide variety of projects, including bespoke insights and analysis for customers as part of our Catalytix offering. They’re comprised of a range of nationalities, so there was no London or Paris bias...